How does LLM watermarking work?
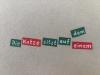
The EU AI Act requires providers of certain AI systems to mark their generated output with a watermark, regardless of the medium—text, image, audio, or video—to the extent that this is technically feasible. Anthropic was the first major provider to respond by announcing that future versions of its Claude language model will embed watermarks in text. It will use a version of SynthID, developed by Google DeepMind; its text variant is discussed in the 2024 paper Scalable watermarking for identifying large language model outputs, which we examine in more detail below.
Watermarking technologies differ significantly between media. An image watermark must be highly robust against filters such as blurring, noise, or distortion, which can make changes barely noticable to humans while still affecting nearly every individual pixel. Text offers far fewer ways to make such automatic alterations, so watermarks can work much more directly with the specific choice and order of words. This naturally raises the question of how much they affect text quality. It may therefore be surprising that, in many scenarios, watermarks can in fact be completely invisible—that is, free of statistical anomalies.
Models Generate Probabilities, Not Tokens
First, a brief explanation of the basics: an LLM does not itself output individual tokens. Instead, it assigns numbers called logits to every token in its vocabulary, with larger numbers expressing a kind of preference. An algorithm then turns these logits into probabilities, taking additional parameters such as temperature into account. We can therefore treat the LLM together with its sampling algorithm as a generator of probabilities, referred to below as the model or model probability. Suppose the model has already generated The cat is sitting on and, for simplicity, we treat each word as one token. It might assign the a probability of and a a probability of as the next word. If we repeat the same generation many times, we get The cat is sitting on the in six cases and The cat is sitting on a in four. In reality, of course, model probabilities depend on the entire context window, which typically contains far more than this one sentence.
This is exactly where watermarks come in: broadly speaking, whenever probabilities are involved, there is room to embed information invisibly. The following simplified method is based on a genuinely researched class of watermarking approaches, but it is not the specific SynthID-Text method. It computes a secret hash from a fixed number of preceding tokens. A hash is essentially a deterministic function whose output—a large number or string—is difficult to predict. All kinds of other objects can be derived from it. In the simplest case, every token in the vocabulary is assigned a bit, either 0 or 1. For , for example, the last four tokens The cat is sitting might produce an assignment such as { "on": 0, "down": 1, ... }. The watermarking method then tries to favor positively marked tokens while ensuring that, averaged over all possible bit assignments, the original probabilities remain exactly unchanged. In this example, we would observe a bias toward down. After a different prefix, the assignment would also be different and might favor on instead. But if we rolled the hash at random rather than computing it, the resulting distribution would always be exactly the one intended by the model.
The Watermark Really Does Remain Invisible Most of the Time
At first glance, this may sound as though it should produce a detectable change in the statistical patterns of the text. That is only partly true. Consider a board game played with a magical die whose outcome depends on the current board position. The die follows no visible pattern and, averaged over every possible position, still produces all six faces with equal probability. In a single game, there would be no statistical anomaly unless a position repeated. Someone who knew the die’s rules, however, could inspect the game record and determine with high confidence whether it had been used, even if it was used only during parts of the game.
Similarly, the only way to detect irregularities in a watermarked text without generating it repeatedly is for the same sequence of tokens to recur. After a fragment such as in other words,, for example, a new clause might begin with the more often than with this because the hash favors the, even though the model itself has no strong preference. But even this is not straightforward: after generating one clause beginning with the, the model could strongly favor beginning the next one with this.
Importantly, the model probabilities are no longer required to verify the watermark, although they would certainly be useful. In naturally generated text, an average of half the tokens should receive a positive mark from the hashing algorithm. Verification simply measures how far the watermark signal deviates from this baseline. Taking the text length into account, we can calculate the probability that an unmarked text would produce an equally strong signal—the same probability that a sequence of fair coin flips would produce a similar result. If this probability is very small, the text was probably generated, at least in part, by an model using the watermark.
The mathematically interesting question is how much signal can be hidden in each token without disturbing the overall probability distribution. The simplest case is a uniform distribution. Suppose the model assigns equal probability to four tokens at some position. We compute their hash markings and, as long as at least one token is marked 1, choose uniformly among the positively marked tokens. Only when all four tokens are marked 0, which happens in one out of 16 cases, do we choose uniformly among all four tokens. In this example, 15 out of 16 generated tokens receive a positive mark, which corresponds to a signal of .
If, on the other hand, the model favors a single token, the algorithm has less freedom. Suppose a token has a model probability of , and the algorithm finds an optimal way to always choose that token whenever it receives a positive mark. This still happens only in of cases. In the remaining , the token must also be selected when it has a negative mark. The watermark signal can therefore be at most , regardless of how the remaining probabilities are distributed among the other tokens.
Practical Limitations
Source code, in which syntax predetermines many tokens, may carry a weaker signal than prose, although it still contains sources of entropy such as comments and variable names. If the model is simply asked to output the numbers from one to ten or the alphabet, there is no opportunity to hide a watermark signal in its answer.
Translation or similarly invasive transformations that substantially alter the sequence of tokens will certainly destroy the signal. Fragmentation alone, such as copying excerpts from a watermarked text, may preserve the signal if the excerpts are long enough. If the hash is computed from the last tokens, only the first tokens of a text block lose the signal when it is copied and inserted into a different context. However, other methods of computing a hash exist, and these technical details may differ from the approach described in the paper.
A Simplified Model
The following demo makes the two-token case concrete. The slider changes the model probability assigned to tokens and . The four rows represent the four equally likely hash states 00, 01, 10, and 11: the first bit marks and the second marks . Each row’s bar shows how often the algorithm selects or in that state. Averaged across all four states, the probability set with the slider is always preserved. This is also visible in the combined length of the dark sections across all four bars.
The watermark signal is the proportion of selected tokens that carry a positive mark. The farther the model probability moves away from a uniform distribution, the less freedom the algorithm has and the weaker the signal becomes. Between and , the signal reaches its maximum of .
Signal strength can be summarized in several ways. As one illustration, the demo uses the expected p-value after ten tokens.1 This particular statistic is not essential to the main argument: the higher the density of positive markings, the more clearly a marked text can be distinguished from an unmarked one.
Four equally likely hash states
Watermark signal
Expected p-value after 10 tokens
A Stronger Signal Through More Bits and Tournament Sampling
It would be even better to extract more than a single bit of information from the hash. With single-bit markings, a token generated without knowledge of the watermark has a chance of receiving a positive mark. Even a perfectly marked individual token therefore provides only a modest statistical signal, because an unmarked token would look equally good in of cases.
This is the approach taken by the authors of the previously mentioned paper Scalable watermarking for identifying large language model outputs. Instead of assigning only one bit to each token, they give every token a marking of independent bits. A tournament is then held. At the start, tokens are sampled according to the model probabilities and divided into pairs. The two tokens in each pair compete using the first bit of their respective markings. If their bits differ, the positively marked token wins; otherwise, the winning token is selected by a fair coin flip. Averaged over all hashes, the winning tokens still follow the model probabilities.2 This leaves tokens for the next round, which uses the second bit of the marking. A simple case with only two tokens and three bits is shown interactively below. Rather than drawing the entire tournament tree, we represent each level as a pie chart showing only the token probabilities at that level:
Wherever the line in the plot runs above the diagonal, the tournament raises the final probability of A relative to its model probability; below the diagonal, it raises the probability of B. For some hash states, the line crosses the diagonal. In these cases, the model probability also determines which token is selected more often than the model alone would predict. In general, however, tokens whose markings contain more positive bits are also more likely to be selected.
Verification can therefore use a simple count of the positive bits in the markings or assign different weights to different bit positions. The paper discusses giving earlier bits more weight, as well as training a Bayesian detector that uses patterns in the bits to distinguish watermarked from unwatermarked text.
Regardless of the details of this method, extracting more information from the hash for the markings can improve the watermark signal. In particular, ties between markings occur less often, and higher entropy in the model distribution can be used more effectively. This also eliminates the plateau between and from the previous example, while probabilities around can now produce an even stronger signal. The same principle could be taken further—for example, by deriving a complete ranking of all tokens from the hash so that ties are ruled out from the start. In practice, however, statistical quality must be balanced against the computational cost of both generating and detecting the watermark.
At Infound, we work on translating current AI research into robust products, understandable interfaces, and responsible applications. If you are designing, evaluating, or preparing an AI system for regulatory requirements, feel free to get in touch with current questions or challenges.
- ↑
A p-value asks how likely an event drawn under the null hypothesis is to score at least as highly as the observed event on the chosen scale. A high p-value therefore provides little evidence against the null hypothesis and is not the desired result. Here, the null hypothesis is an unmarked text, and the density of positive markings is a natural score, capped at because lower values carry no evidence for the watermark. Every text with a positive-token density of or less is therefore assigned a p-value of . Even in the fully deterministic case, where there is effectively no watermark, more than of the markings can happen to be positive, producing a smaller p-value. The expected p-value is consequently never and reaches at most about . A more informative statistic would account separately for the probabilities of false positives and false negatives.
- ↑
Consider a token with initial probability . The pair is drawn with probability , while a mixed pair containing is drawn with probability . Averaged over all markings, wins a mixed pair half the time. The probability that advances from a particular pair is therefore , so the distribution of advancing tokens is once again the original distribution.